-3.png?width=250&height=128&name=Wink%20Toolbox%20Logo_Colour%20(1)-3.png)
This tutorial will take you step-by-step through creating a report in Wink v2
It assumes you have already logged in, created an organisation, and activated at least one connector.
By the end of this tutorial, you will understand data sources, filters, grouping/sorting, and adding/removing columns.
1. Creating a report in Wink v2
2. Under the Wink v2 Home Screen, click on the Reports tab found on the left side of the page.
3. Click on the New Report button and afterwards click on the Blank Report option to create a new report in Wink v2. 
4. Next, choose the data source that you want to use in the report. There are numerous integrations and data sources available in Wink v2, so be sure to navigate through these options and find the right source for your use case. 
5. Click “Select View Type” once you’ve decided on a data source to work with.
6. Choose what type of report you would like to use from the various report options in Wink v2.
- Tables are commonly used for reports.
- other types are usually reserved for dashboards.
Designing Your Report
Adding/Removing Columns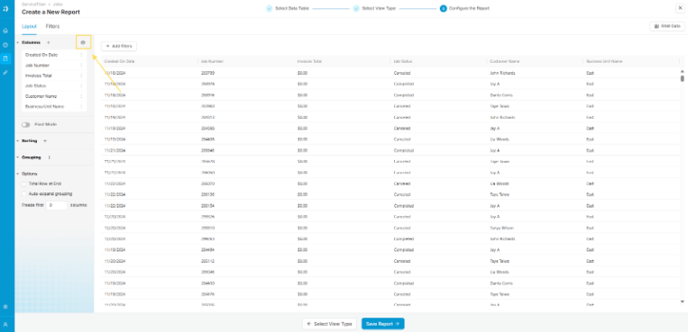
1. To add or remove columns in your report, click on the gear symbol on the upper left portion of the report designer. This will allow you to manage the columns in your report
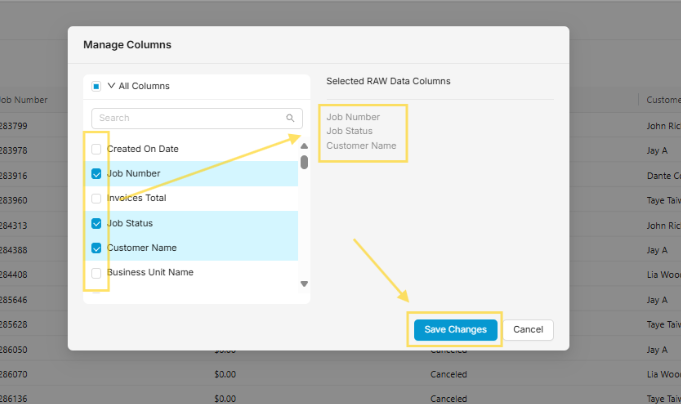
2. A pop-up will appear displaying the available columns you can add to your report.
- Check or uncheck the boxes next to each column to include or remove them.
- Refer to the list of selected columns on the right to confirm your choices.
- Click "Save Changes" to apply the updates.
Sorting your Report
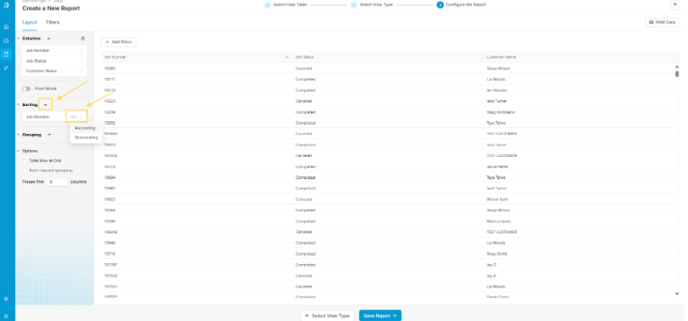
- You can sort your report by clicking the plus button next to Sorting, which will open a dropdown showing the available columns to sort by.
- You can apply sorting using multiple columns, and the sorting hierarchy will follow the order in which the columns are added.
- Each column can also be sorted in either ascending or descending order.
Grouping your Report
- Grouping in data analysis allows you to organize data into categories or segments based on shared values, enabling easier summarization and comparison.

The process is similar to sorting:
-
Click the plus button next to Grouping to open a dropdown menu showing the list of columns you can use to group your data.
Other Options
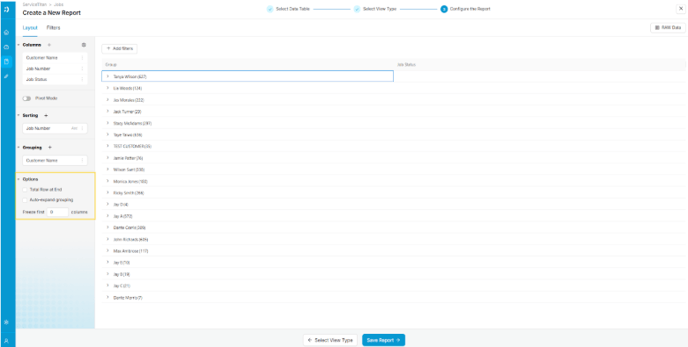
- Total Row at the End displays a total value at the bottom of each non-text column in the report.
- Auto Expand Grouping automatically expands grouped sections when the report is opened, saving you from manually expanding them each time.
- Freeze First X Columns keeps the first few columns fixed in place, ensuring they remain visible as you scroll across a wide report.