-3.png?width=250&height=128&name=Wink%20Toolbox%20Logo_Colour%20(1)-3.png)
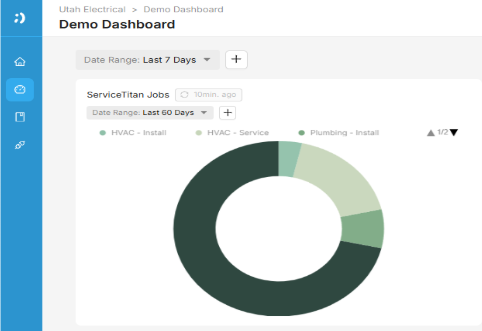
1. Log in to Wink v2, then navigate to the dashboard where you'd like to add the Doughnut Chart.
-
- If the dashboard doesn’t exist yet, create a new one before proceeding.

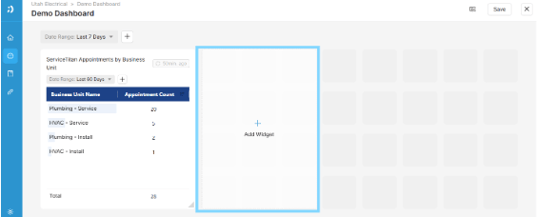
3. Click the “+ Add Widget” button to begin adding a new chart.
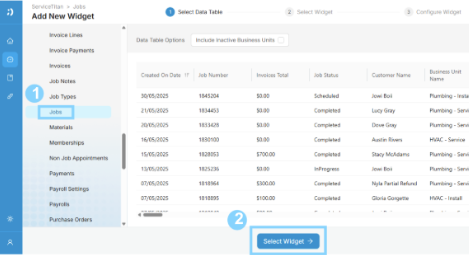
4. In the widget setup panel:
a. Select your desired Data Source from the left-hand panel.
b. Then, click the “Select Widget” button.
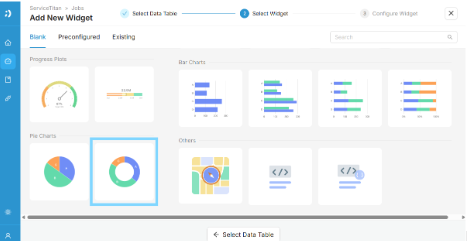
5. From the available widget options, choose “Doughnut Chart.”
6. In the “Setup” tab:
a. Configure the Slices and Values to define how the chart data is grouped and measured.
b. You can also customize the Inner Radius and Outer Radius to adjust the visual proportions of the chart.

7. In the “Customize” tab:
a. Modify slice colors, add labels, align the legend, and update the Widget Name (Dashlet Title) as needed.

8. Once all settings are configured, click “Save Widget” to add the Pie Chart to your dashboard.