-3.png?width=250&height=128&name=Wink%20Toolbox%20Logo_Colour%20(1)-3.png)
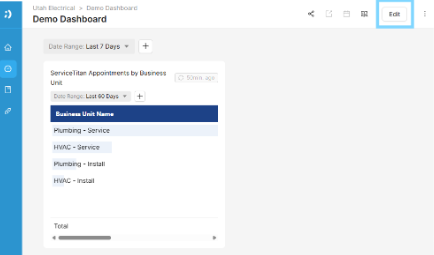
1. Log in to Wink v2, then navigate to the dashboard where you'd like to add the Map.
-
- If the dashboard doesn’t exist yet, create a new one before proceeding.
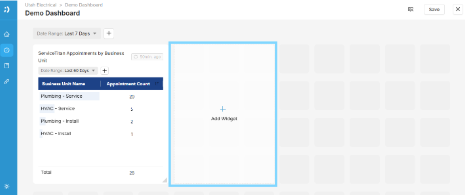
3. Click the “+ Add Widget” button to begin adding a new chart.
4. In the widget setup panel:
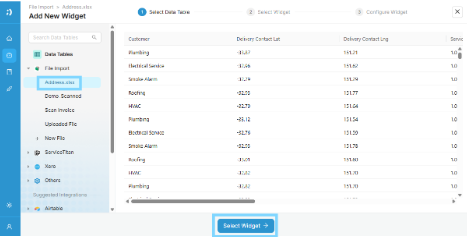
a. Select your desired Data Source from the left-hand panel.
b. Then, click the “Select Widget” button.
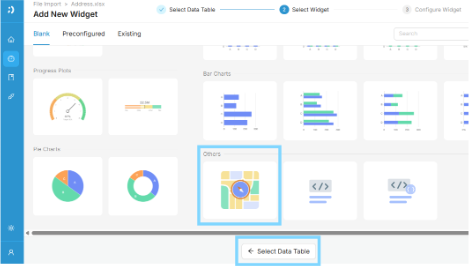
5. From the available widget options, choose “Map”.
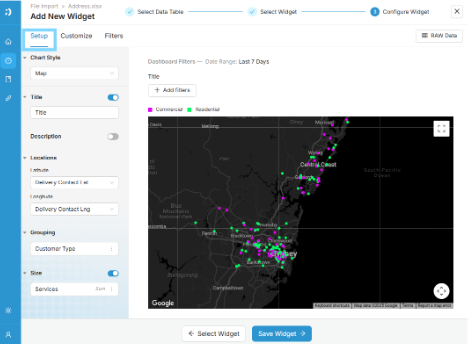
6. In the “Setup” tab, you can configure the Location Latitude and Longitude fields, and optionally group the data based on available attributes from your selected data source.
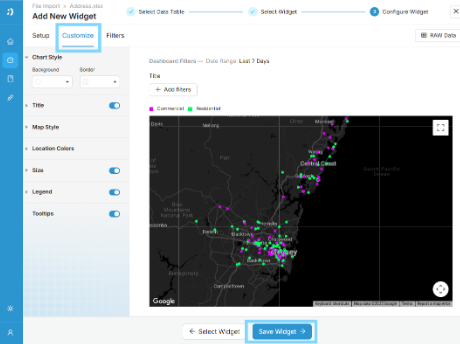
7. In the “Customize” tab, you can personalize the Dashlet Title, select a preferred Map Style, and adjust the Location Colors to suit your visual preferences or branding.
8. Once all settings are configured, click “Save Widget” to add the Pie Chart to your dashboard.
Your Map widget is now added to the dashboard. You can always go back and tweak the settings to better fit your data or styling preferences.