-3.png?width=250&height=128&name=Wink%20Toolbox%20Logo_Colour%20(1)-3.png)
Note: Conditional formatting in Dashboard is only available for Table dashlet
In order to add the Table Dashlet, you will need to have a dashboard.
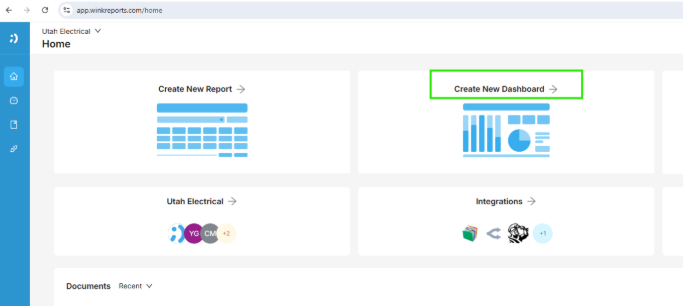
- If you haven’t created a dashboard, you may do so by:
-
-
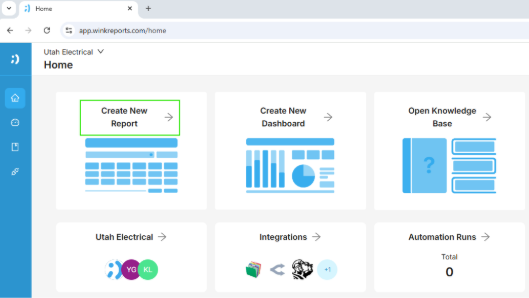
Selecting “Create New Dashboard” on the homepage
-
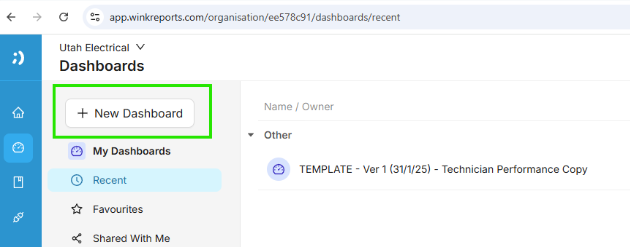
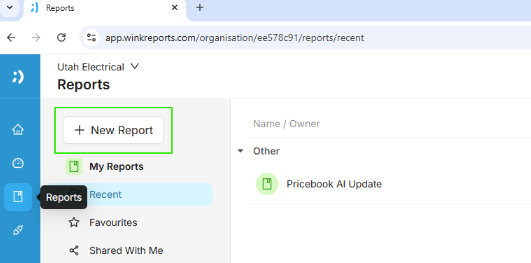
OR clicking the Dashboard icon on the left corner then selecting “+ New Dashboard”
-
-
If you already have an existing dashboard, please open it and proceed to step 2.
3. Dashboard in Dashboard page
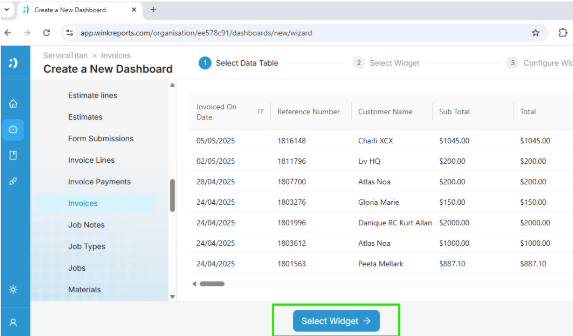
4. After creating a new dashboard, you will need to:
- Select the “Data Source” from the available connectors in your organisation.
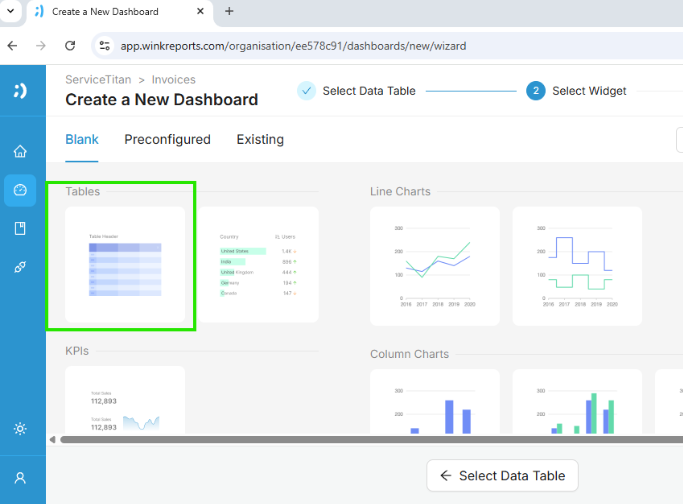
- Click the “Select Widget” button.
5. On the next page, select the “Table” dashlet.
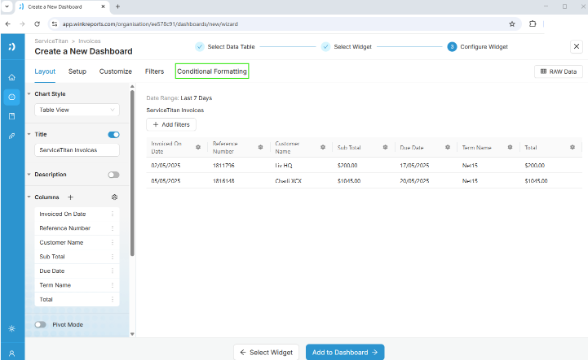
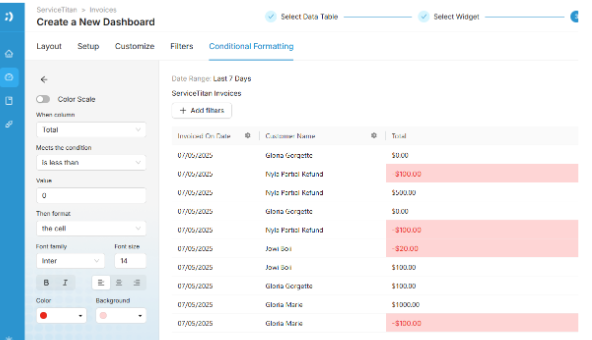
6. Click the “Conditional Formatting” in the layout.
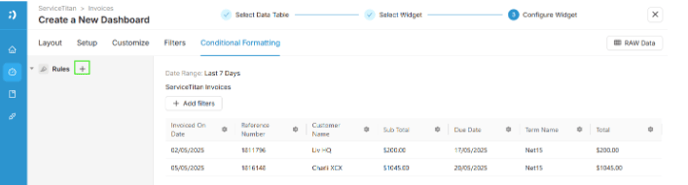
7. Click on the “+” icon beside rules to select your conditional formatting.
Types Conditional Formatting.
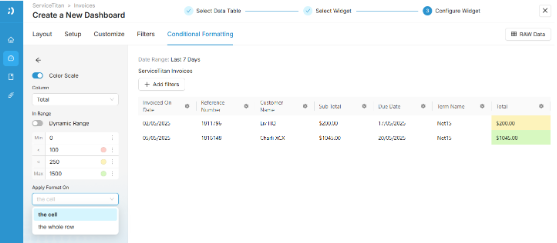
Color Scale
-
Uses a gradient of colors to highlight cells based on their values, making it easier to visually identify data trends and patterns
-
Toggle the “Color Scale”
-
Select “Column” where the color scale will be based
-
Adjust the scale depending on what you need and you can also change the color
-
“Apply Format On”: You can select if this will only apply on the selected column or for the whole row.
Highlighting Cells
-
You can highlight based on the column’s text, number, dates, or blanks
-
Select what column the highlight will be based from
-
Set the condition (e.g., equal text, is not blank, or greater than)
-
Then add the value of the data
-
“Then Format”: You can select if this will only apply on the selected column or for the whole row
-
Set the data format based on your preference (e.g., if the number in total is less than 0, set the font color or background to red)
Report
1. Create a Report
- You can create a report directly from the Home page
- or by going to the Reports in the left corner.
2. Home Page
3. Reports in Reports Page
4. Select “Blank Report”
- After creating a new report, you will need to select the “Data Source” from the available connectors in your organisation.
- Then click the “Select Widget” button.
6. Click the “Save Report” button.
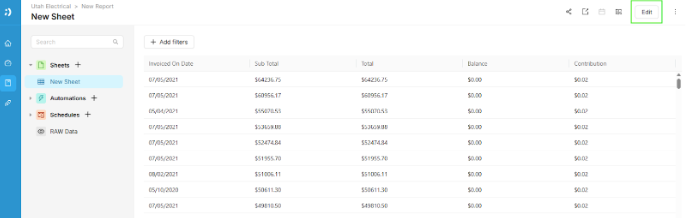
7. Once you save the report
- You will be directed to the sample page below.
- Then click the “Edit” button in the upper right corner.
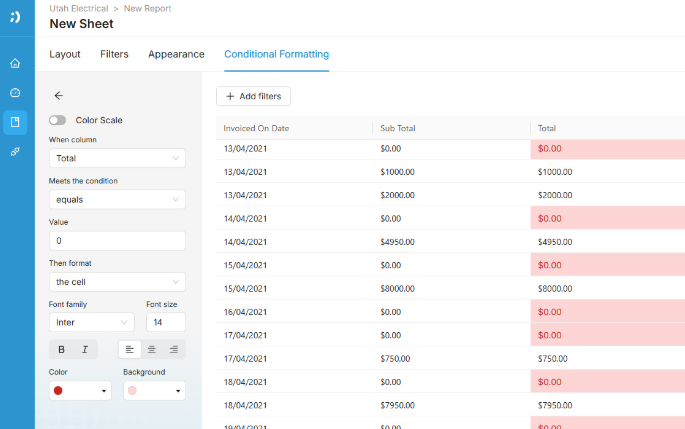
8. Click the “Conditional Formatting” in the layout.
9. Click on the “+” icon beside rules to select your conditional formatting.
Types Conditional Formatting.
Color Scale
-
Uses a gradient of colors to highlight cells based on their values, making it easier to visually identify data trends and patterns.
-
Toggle the “Color Scale”
-
Select “Column” where the color scale will be based.
-
Adjust the scale depending on what you need and you can also change the color.
-
“Apply Format On”: You can select if this will only apply on the selected column or for the whole row.

Highlighting Cells
-
You can highlight based on the column’s text, number, dates, or blanks
-
Select what column the highlight will be based from
-
Set the condition (e.g., equal text, is not blank, or greater than)
-
Then add the value of the data
-
“Then Format”: You can select if this will only apply on the selected column or for the whole row
-
Set the data format based on your preference (e.g., if the number in total is equal to 0, set the font color or background to red)